Illustrative example
Explore how an operational project could work.
These scenarios and sample figures illustrate an approach. They are not verified client results or a promise of savings. Actual scope and outcomes depend on the data, systems and operating conditions.
Illustrative example. These scenarios and sample figures illustrate an approach. They are not verified client results or a promise of savings. Actual scope and outcomes depend on the data, systems and operating conditions.
Featured engagement
Example operatorMaritime
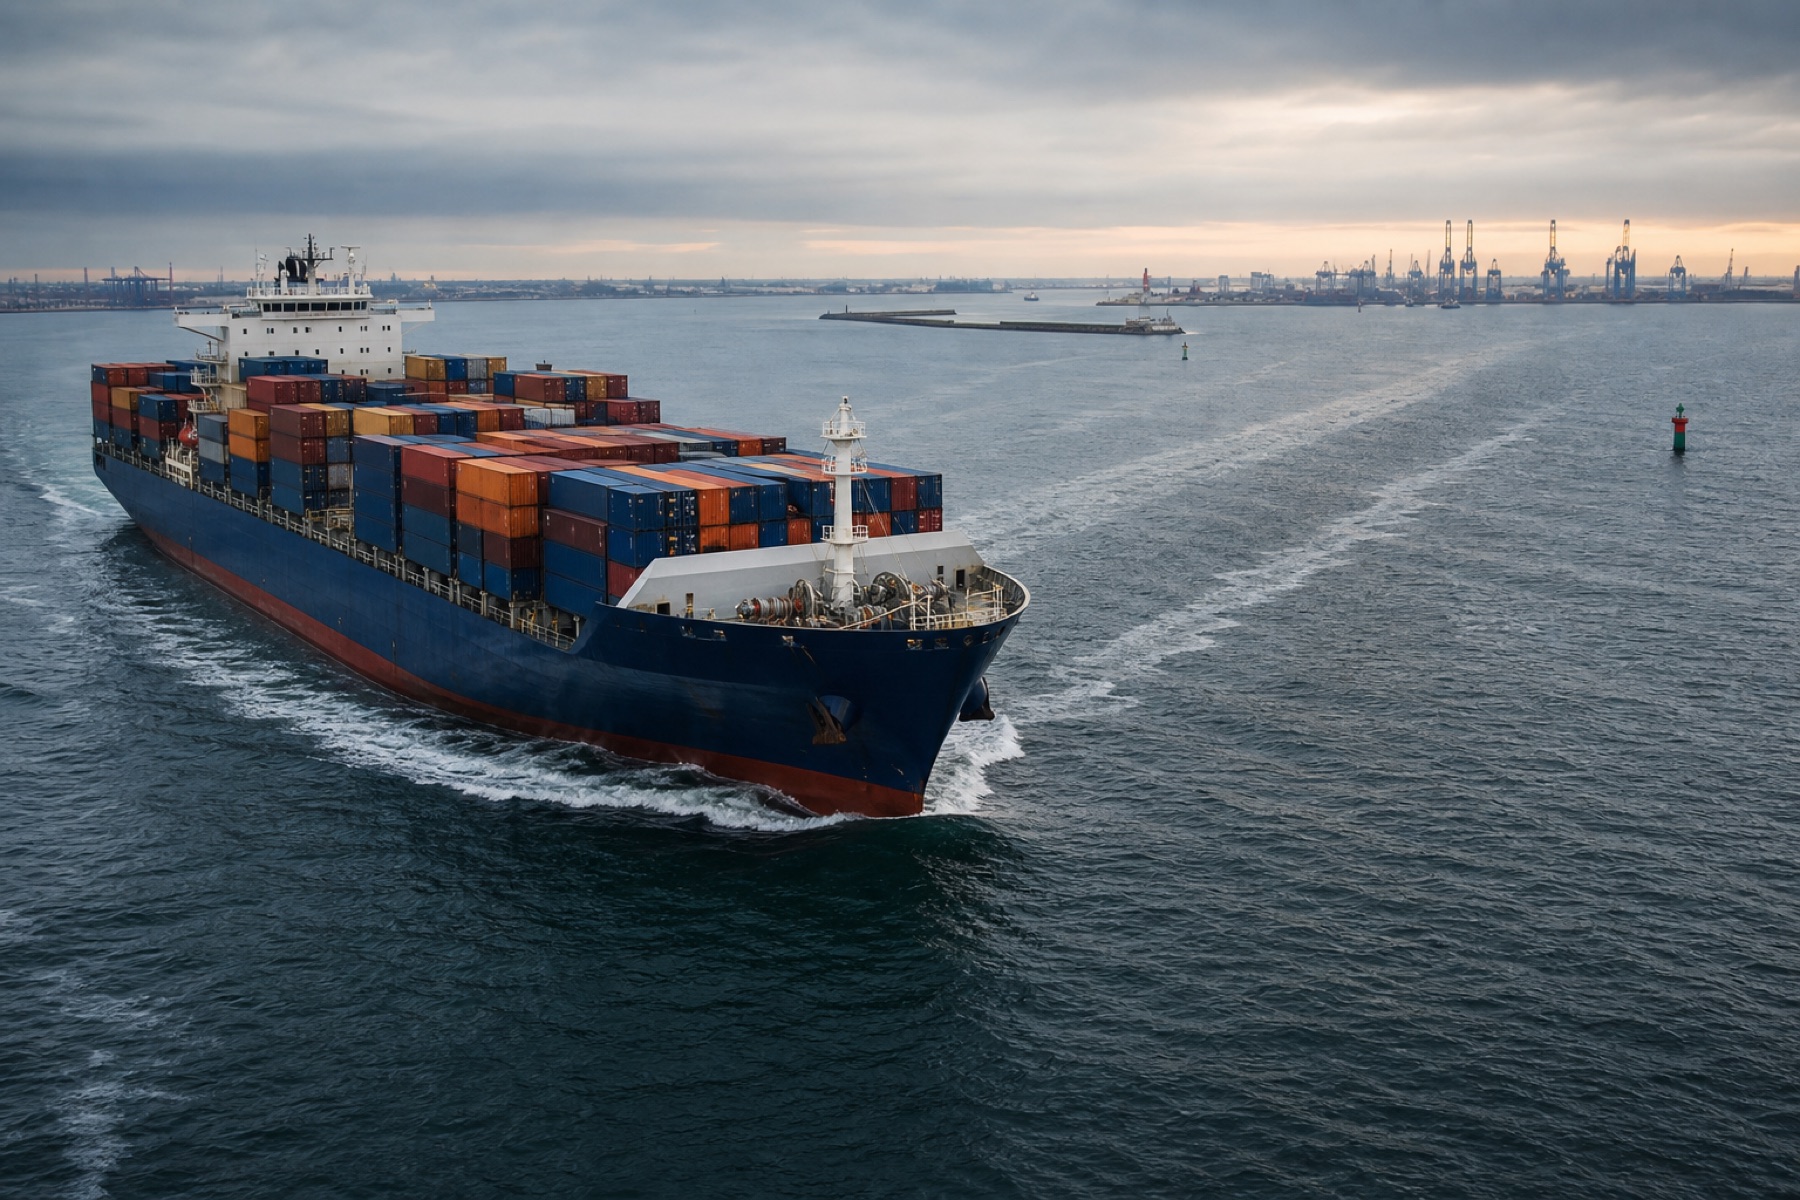
Global Fleet Route Optimisation
Dynamic routing across 150+ vessels. Live weather, ocean current, and port-congestion feeds cut bunker spend and emissions.
18% Fuel Cost Reduction
Measured against the project baseline
How results are reported
The published summaries do not include the baseline and follow-up dates or the underlying datasets. Client details may be anonymised. Ask us for the measurement method behind a specific result.

Maritime
Vessel Predictive Maintenance Platform
Example operator
Edge-to-cloud IoT pipeline across 1,800+ onboard sensors on 40 vessels. Detects engine and propulsion pre-failure signatures weeks before breakdown.
99.1% Fleet Uptime
Read Study 
Supply Chain Logistics
Last-Mile Logistics Transformation
Example operator
Real-time geospatial routing engine and AI-driven warehouse slotting cut delivery times by 30% and reduced driver overtime across 400 urban routes.
30% Faster Deliveries
Read Study 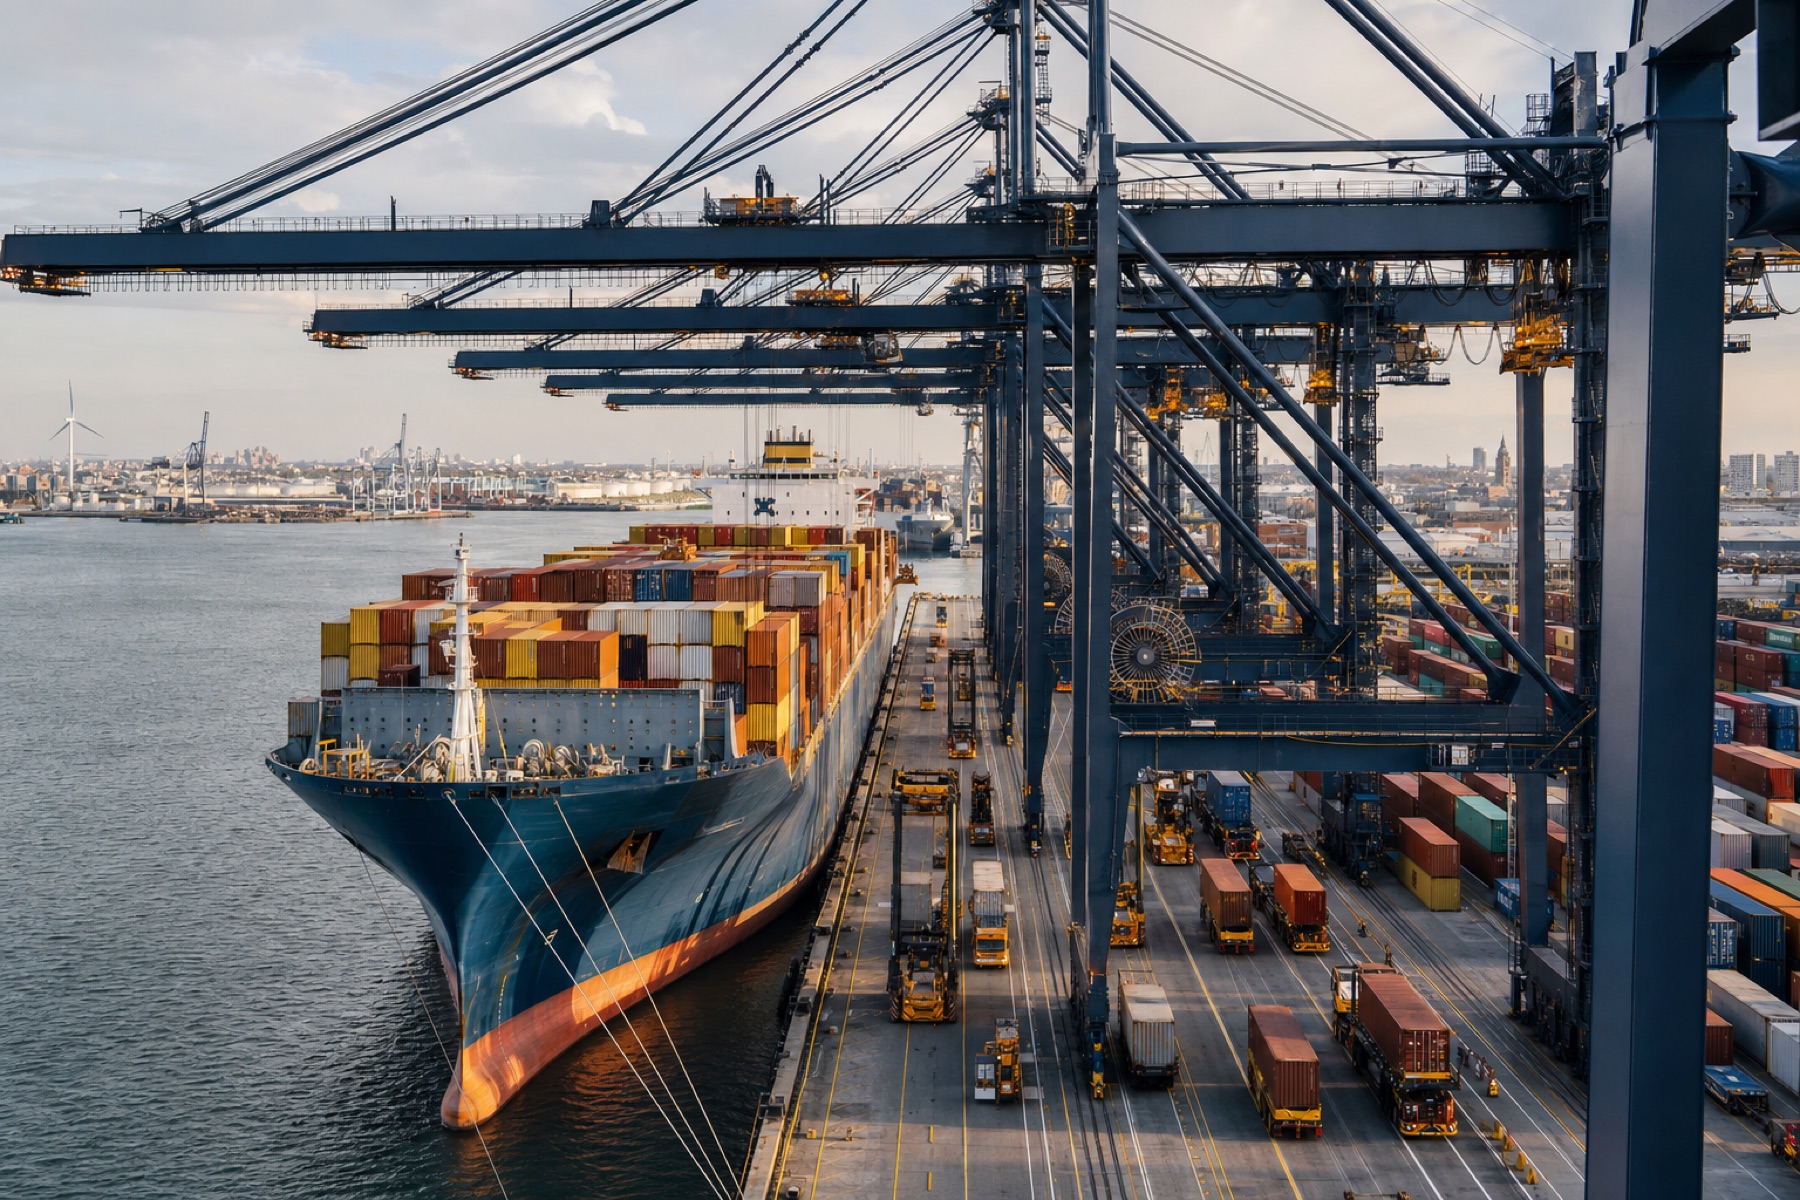
Maritime
Smart Port Turnaround Optimisation
Example operator
Computer vision crane tracking and ML-driven yard scheduling cut vessel turnaround from 36 to 24 hours and boosted throughput by 25%. No new infrastructure.
25% Higher Throughput
Read Study 
Supply Chain Logistics
Long-Haul Route Optimisation & Driver Scheduling
Example operator
Multi-objective VRP engine for 340 HGVs across Spain's national highway network cut fuel spend by 18%, raised on-time delivery to 94%, and automated EU 561/2006 drivers' hours compliance.
18% Fuel Cost Reduction
Read Study 
Supply Chain Logistics
Inventory Resilience & Risk Profiling
Example operator
Dynamic safety-stock algorithm driven by real-time supplier-risk signals cut peak-season stockouts by 40% while reducing excess-inventory holding costs by 15%.
40% Less Stockouts
Read Study 
Energy
LNG Carrier Scheduling System
Example operator
Mixed-integer linear programming scheduler replaced 3-day spreadsheet planning cycles with 2-hour optimised cargo plans, saving $2.4 M annually in boil-off and demurrage.
$2.4M Saved Annually
Read Study Start with the decision
Turn one operational challenge into a measurable data plan.
Tell us about your challenge. We will reply to arrange an assessment and identify a practical route to delivery.
Request a data assessment