Back to Case Studies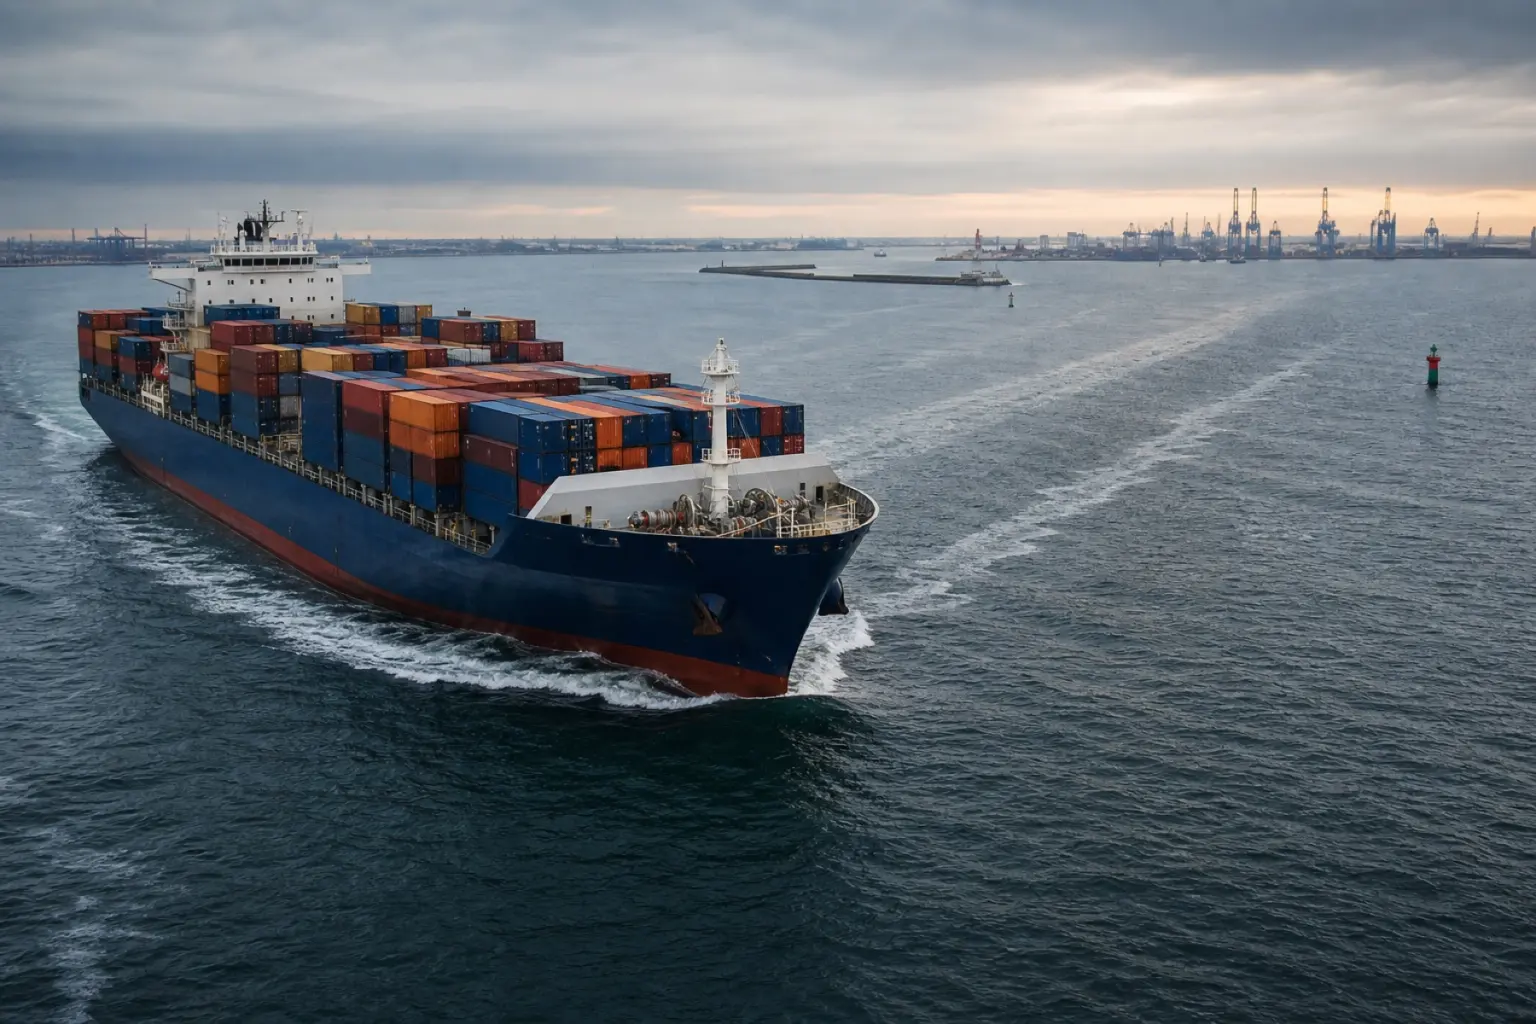
MaritimeTransOceanic Shipping (name changed)
Global Fleet Route Optimisation
Case study. Client names are changed for confidentiality. Results are measured against each client's pre-project baseline.
18%
Bunker Cost Reduction
Saving over $12 M annually across the fleet.
94%
On-Time Arrival Rate
Up from 82% — a 12-point jump in schedule reliability.
45 k t
CO₂ Avoided Year 1
Equivalent to removing ~10,000 passenger cars from the road.
11 hrs
Avg. Steaming Time Saved
Per voyage, freeing capacity without adding a single vessel.
Case studyClient names are changed for confidentiality. Results are measured against each client's pre-project baseline.
The Challenge
TransOceanic Shipping had 150 vessels on static routing plans built from week-old weather charts. They could not react to real-time ocean-current shifts or last-minute port closures. The result was an average of 11 hours of wasted steaming per voyage and ETAs that nobody trusted.
Our Approach
- 1
Ingested AIS vessel-position data, NOAA GRIB2 weather grids, and port congestion APIs into a unified streaming pipeline.
- 2
Built a Digital Twin per vessel using actual hull-resistance and engine-load curves to simulate fuel consumption against any candidate route.
- 3
Trained an XGBoost ensemble on 8 years of historical voyage data to predict optimum speed and heading adjustments in 4-hour windows.
- 4
Deployed a Power BI-embedded captain's dashboard with visual route overlays, risk scores, selectable alternatives, and one-click acceptance.
- 5
Integrated automated ETA notifications to charterers via API, closing the loop from model output to commercial communication.
The Solution
We built a routing system that continuously re-evaluates each vessel's optimal path. It ingests live satellite weather, wave-height, and current data every 15 minutes, feeds them into per-vessel physics models, and surfaces ranked route recommendations to bridge officers via a custom Power BI dashboard. Captains keep final authority — but they have data-backed alternatives instead of gut feel.
Tech Stack
Data Engineering
Python (Pandas, NumPy)
Core data wrangling, route-simulation logic, and batch preprocessing of GRIB2 weather files.
Apache Kafka
Real-time streaming of AIS position events and weather-grid updates at sub-minute latency.
PostGIS (PostgreSQL)
Geospatial storage of historical voyage tracks, waypoints, and port-boundary polygons.
ML / AI
XGBoost
Gradient-boosted ensemble predicting optimal speed-heading combinations per 4-hour waypoint.
Integration
NOAA / Copernicus APIs
Hyper-local ocean current, wave-height, and atmospheric-pressure data ingested every 15 minutes.
Infrastructure
AWS SageMaker
Managed model training, versioning, and blue-green deployment with auto-scaling inference endpoints.
Docker / Kubernetes
Containerised microservices for the routing engine, ensuring zero-downtime updates at sea.
Visualisation
Power BI Embedded
Captain-facing route dashboard surfaced inside the ship's existing ECDIS interface.
Related reading
Face a similar challenge?
Send us your challenge. We will reply to arrange a conversation and scope the next step.
Start with the decision
Turn one operational challenge into a measurable data plan.
Tell us about your challenge. We will reply to arrange an assessment and identify a practical route to delivery.
Request a data assessment