Back to Case Studies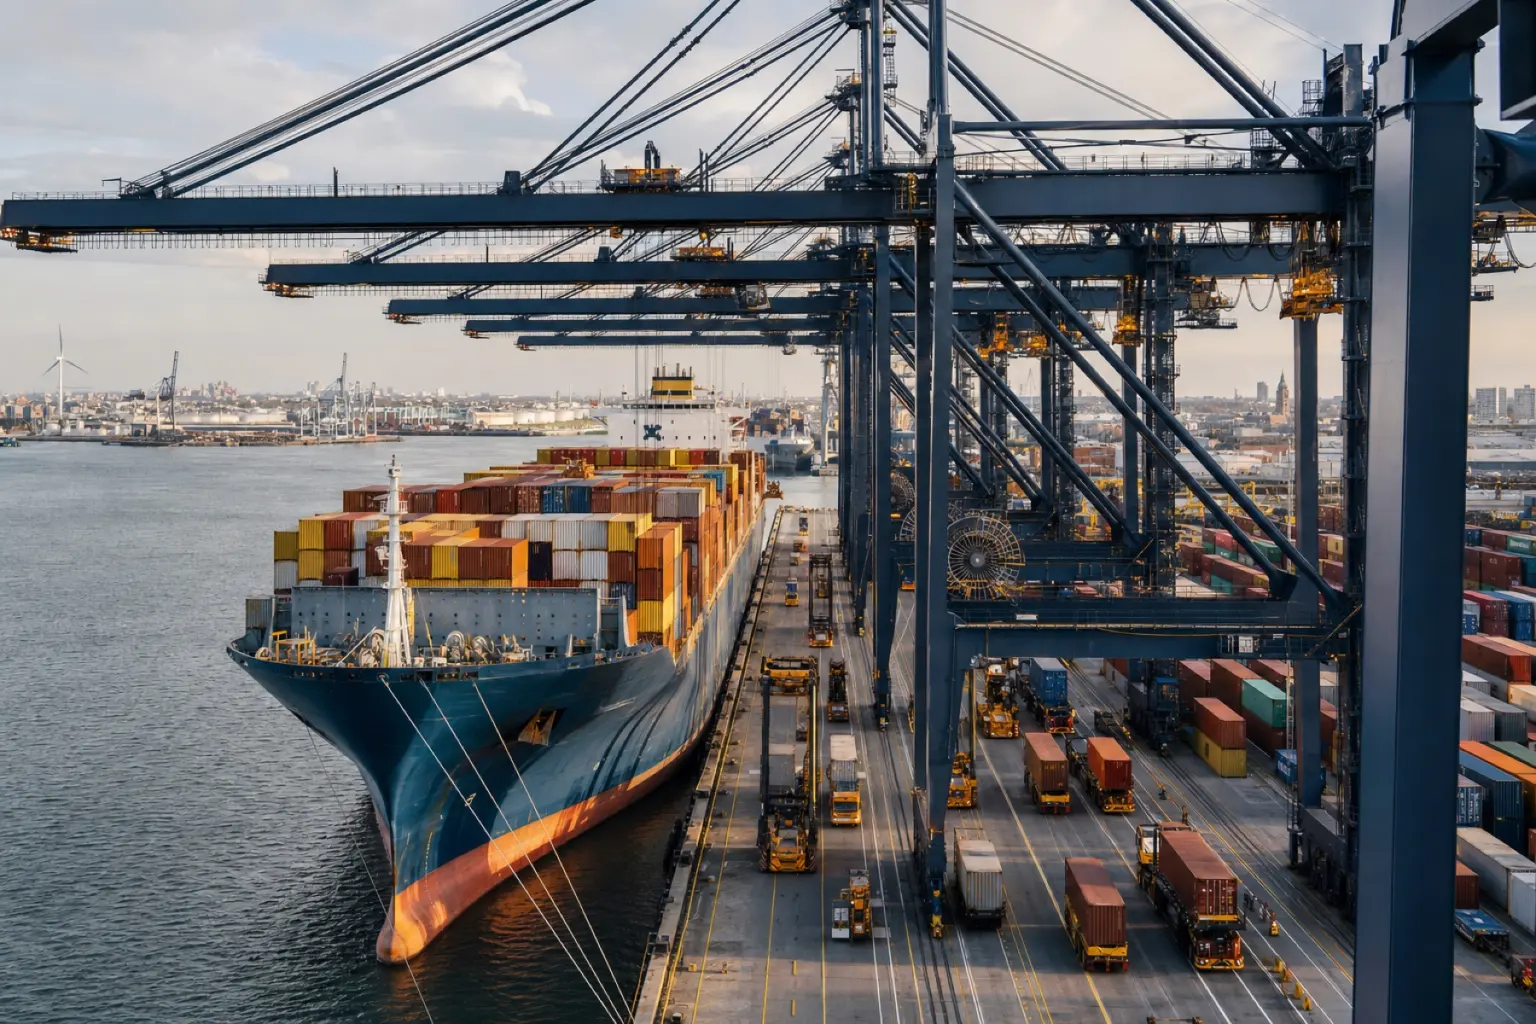
MaritimePacific Ports Authority (name changed)
Smart Port Turnaround Optimisation
Case study. Client names are changed for confidentiality. Results are measured against each client's pre-project baseline.
25%
Throughput Increase
Without adding cranes, berths, or land — pure operational intelligence.
12 hrs
Turnaround Time Saved
Vessel time in port dropped from 36 to 24 hours on average.
90%
Data Entry Errors Eliminated
Automated vision-based container scanning replaced error-prone manual logging.
2.4 → 0.9
Re-handles Per Container
Optimised stack placement cut re-handle rate by 62%, directly freeing crane capacity.
Case studyClient names are changed for confidentiality. Results are measured against each client's pre-project baseline.
The Challenge
Pacific Ports Authority was at capacity. Yard congestion meant vessels queued at anchor for 12–18 hours, costing shipping lines up to $80,000/day in demurrage. Containers needed an average of 2.4 re-handles to reach the correct vessel, and manual gate-in/gate-out data entry had an 8% error rate.
Our Approach
- 1
Installed 4K IP cameras on all 14 ship-to-shore cranes and 6 gate lanes; a YOLOv8 model reads ISO codes at 98.5% accuracy in all lighting conditions.
- 2
Built a Kafka event bus where each container scan generates an immutable event consumed by the yard-management optimiser and vessel ETA engine.
- 3
Developed a constraint-satisfaction optimiser for crane-move scheduling that minimises re-handles by sequencing moves against predicted vessel departure windows.
- 4
Replaced paper dockets with RFID-integrated truck booking slots, synchronising arrivals with crane availability windows.
- 5
Deployed a React + D3.js operations dashboard giving planners a live birds-eye view of yard occupancy, crane utilisation, and vessel time-to-departure.
The Solution
We built an automated container-tracking and yard-intelligence platform. Computer vision reads every container ID as it moves — crane pick, set-down, gate transit — eliminating manual entry. This live position data feeds a scheduling optimiser that sequences all crane moves to minimise re-handles and maximise vessel throughput.
Tech Stack
ML / AI
YOLOv8 (Ultralytics)
Real-time container ISO-code and truck-plate detection at 30 fps across 20 camera feeds.
OpenCV
Image pre-processing pipeline: lens distortion correction, contrast normalisation, ROI cropping.
Google OR-Tools
Constraint-satisfaction solver for crane-move sequencing against vessel departure deadlines.
Infrastructure
TensorFlow Serving
Low-latency model inference server hosted on GPU nodes within the port's private cloud.
Redis
In-memory cache for live yard-position state — sub-millisecond lookup for the optimiser.
Data Engineering
Apache Kafka
Immutable container-event log consumed by the optimiser, ETA engine, and billing system.
Oracle Database
Master records for vessel calls, terminal operating system integration, and audit logs.
Visualisation
React + D3.js
Interactive yard planner: live slot-map, crane utilisation heat map, and vessel ETA timeline.
Face a similar challenge?
Send us your challenge. We will reply to arrange a conversation and scope the next step.
Start with the decision
Turn one operational challenge into a measurable data plan.
Tell us about your challenge. We will reply to arrange an assessment and identify a practical route to delivery.
Request a data assessment